blog lvobo
Trang chủ

Sieve Analysis

Sieve Analysis

  • Electromagnetic Sieve Shakers in Laboratory Particle Size Analysis: Principles and Method Considerations
    Electromagnetic Sieve Shakers in Laboratory Particle Size Analysis: Principles and Method Considerations
    Oct 30, 2026
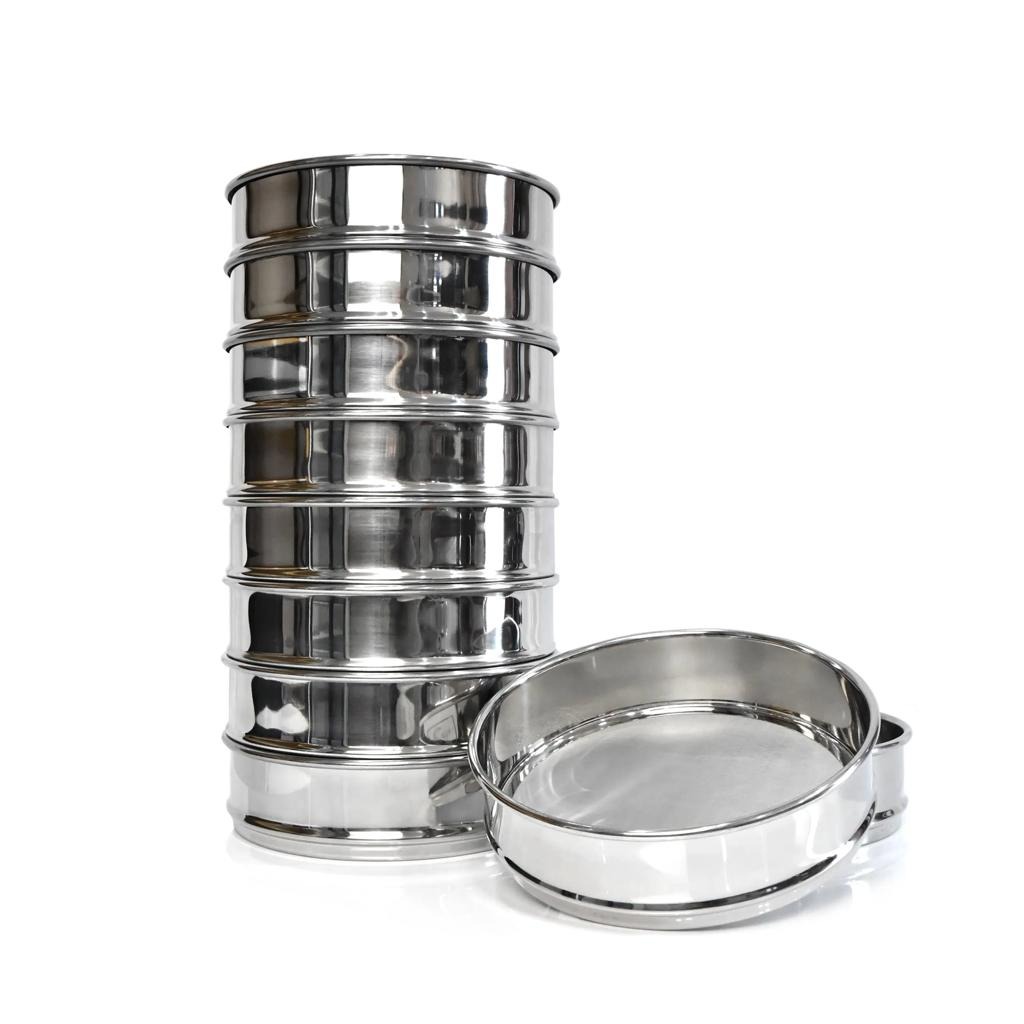
    Abstract Sieve analysis is a commonly used method for determining the particle size distribution of powders and granular materials. The reliability of the results depends on several factors, including sample characteristics, sieve aperture selection, sample loading, sieving motion, and test conditions. Electromagnetic sieve shakers provide a mechanical approach to laboratory particle separation through controlled electromagnetic excitation. This article examines the basic principles of sieve analysis, the factors affecting measurement results, and the considerations involved in selecting an electromagnetic sieve shaker for laboratory applications. 1. Principles of Laboratory Sieve Analysis Sieve analysis separates particles according to their ability to pass through defined sieve apertures. A series of test sieves with progressively smaller openings is commonly arranged in a stack, allowing a sample to be divided into several particle size fractions. During the test, particles interact with the sieve openings through movement, contact, and changes in orientation. Particles that pass through an aperture are collected in the next sieve or receiving pan, while larger particles remain on the corresponding sieve. The resulting distribution is generally expressed as the mass percentage retained on each sieve or passing through a specified aperture. It is important to distinguish sieve size from an absolute geometric particle diameter. For irregularly shaped particles, the probability of passing through an aperture can depend on particle orientation as well as its dimensions. 2. Electromagnetic Excitation and Sieving Motion The motion applied to a sieve stack influences how particles are distributed across the sieve surface and how frequently they encounter the mesh openings. In vibratory sieving, particle movement can involve vertical displacement combined with lateral or circular motion. This produces a three-dimensional movement pattern in which particles are repeatedly lifted, redistributed, and brought into contact with the sieve surface. An electromagnetic sieve shaker uses electromagnetic excitation to generate the driving vibration. The vibration is transferred to the sieve assembly, where the resulting motion supports particle separation. Amplitude is one of the important parameters affecting sieve movement. Changes in amplitude influence the intensity of particle movement and should be considered together with sample properties and sieve loading. The appropriate operating conditions are material-dependent. A single setting should not be assumed suitable for all powders and particle size ranges. 3. Factors Affecting Sieve Analysis Results Sieve analysis is influenced by both the physical properties of the sample and the conditions under which the test is performed. 3.1 Sample Representativeness The test sample should represent the original material as closely as possible. Particle segregation may occur during storage, transportation, or handling, resulting in differences between the collected sample and the bulk material. Sample mixing and appropriate sample division are therefore important steps before testing. 3.2 Sample Quantity and Sieve Loading The amount of material placed on a sieve affects the distribution of particles across the mesh surface. Excessive loading can create a thick particle layer, reducing the available contact area between particles and sieve openings. Insufficient sample quantities, on the other hand, may not adequately represent the original material. Sample quantity should be considered in relation to particle size, material density, sieve diameter, and the required measurement procedure. 3.3 Particle Properties Several material characteristics can influence the sieving process: Particle size distribution Particle shape and aspect ratio Bulk density Moisture content Agglomeration tendency Electrostatic charging Fine powders and particles with strong interparticle attraction may form agglomerates or adhere to the sieve mesh. These conditions can affect particle passage and the resulting size distribution. 3.4 Sieve Aperture and Condition Sieve selection determines the particle size intervals obtained during analysis. The selected apertures should cover the expected particle size range and correspond to the required classification intervals. The physical condition of the sieve is also important. Blocked, damaged, or contaminated mesh openings can influence the separation process. Test sieves should therefore be inspected and cleaned using methods appropriate to their mesh construction. 3.5 Operating Conditions Vibration amplitude, sieving duration, sample loading, and the characteristics of the material can all influence the observed results. For comparative testing, the operating conditions should be documented and kept consistent. Changes in test conditions may produce differences in particle distribution even when the original material is unchanged. 4. General Procedure for Laboratory Sieve Analysis A typical laboratory sieve analysis involves the following stages: Step 1 — Sample Preparation Obtain a representative sample from the original material. Mix and divide the sample when necessary. Step 2 — Sieve Selection Select the sieve diameters and aperture sizes according to the expected particle size distribution and the required number of fractions. Step 3 — Initial Weighing Determine and record the initial sample mass using an appropriate balance. Step 4 — Sieve Assembly Arrange the test sieves in the selected sequence, with larger apertures above smaller apertures, and secure the sieve stack. Step 5 — Sieving Apply the selected sieving method and documented operating conditions. The sample moves across the sieve surfaces and is separated according to the corresponding apertures. Step 6 — Fraction Recovery Collect the material retained on each sieve and in the receiving pan separately. Step 7 — Weighing and Evaluation Determine the mass of each recovered fraction and calculate the corresponding mass percentages. Step 8 — Sieve Inspection Inspect and clean the test sieves before subsequent measurements. 5. Evaluation of Particle Size Distribution The results of sieve analysis are generally evaluated using the mass of material retained on individual sieves. The mass percentage retained on a particular sieve can be calculated as: Mass Percentage Retained (%) = (Mass of Fraction / Total Recovered Mass) × 100 The cumulative retained percentage is obtained by adding the retained percentages from the largest aperture down to the sieve being evaluated. The cumulative passing percentage can then be calculated as: Cumulative Passing (%) = 100 − Cumulative Retained (%) Results may be presented in a data table or particle size distribution curve. The mass balance between the initial sample and the recovered fractions should also be checked. Any material loss should be recorded because it may affect the interpretation of the results. 6. Considerations When Selecting an Electromagnetic Sieve Shaker The selection of laboratory sieving equipment should be based on the intended test method and the characteristics of the material. The following factors are generally considered: Selection Factor Technical Consideration Sample Characteristics Particle shape, density, moisture and agglomeration Particle Size Range Expected minimum and maximum particle sizes Sieve Diameter Available working area and sample loading Sieve Apertures Required particle size intervals Number of Fractions Number of sieve layers required Vibration Amplitude Suitable vibration intensity for the sample Sample Quantity Required mass for each test Test Conditions Repeatability and consistency of operating parameters The equipment configuration should be evaluated against the laboratory's actual testing requirements rather than selected solely by nominal machine capacity. 7. Electromagnetic Sieve Shaker: BO-300ESS Technical Example The LVOBO BO-300ESS is an electromagnetic sieve shaker developed for laboratory particle size analysis, powder classification, and sieve residue testing. Its operating system uses electromagnetic excitation to generate high-frequency reciprocating vibration and three-dimensional sieving motion. The main configuration includes: Parameter Specification Model BO-300ESS Excitation Method Electromagnetic Input Voltage AC 220V Input Power 1000 W Amplitude 0–3 mm, continuously adjustable Sieve Diameter 200 mm / 300 mm Available Mesh Range 8–2000 mesh, depending on configuration Sieve Layers 1–7 layers Approximate Sample Capacity 5–1000 g per batch Control Interface Touchscreen Recipe Management Multiple recipe storage and recall Main Unit Dimensions D420 × W380 × H295 mm, without sieve stack The actual sample capacity depends on material properties, particle size distribution, sieve aperture, and testing requirements. The available sieve configuration should also be confirmed according to the intended application. These specifications describe the equipment configuration. They do not replace the need to establish and validate suitable testing conditions for individual materials. 8. Conclusion Laboratory sieve analysis involves more than selecting a sieve shaker and a set of test sieves. Sample representativeness, particle characteristics, sieve aperture selection, sample loading, operating conditions, and data evaluation all contribute to the final particle size distribution. Electromagnetic excitation is one of the available approaches for generating vibratory motion in laboratory sieve analysis. Its application should be evaluated in relation to the material being tested and the requirements of the analytical procedure. A well-defined testing method, together with appropriate equipment configuration and consistent sample handling, provides the basis for meaningful particle size analysis and comparison between laboratory tests. Technical Note This article provides general technical information on laboratory sieve analysis. Specific testing procedures, operating conditions, and acceptance criteria should be established according to the material, applicable test method, and laboratory requirements.
    ĐỌC THÊM
  • Why Particle Size Test Results Change: Dispersion, Agglomeration and Sieving Conditions
    Why Particle Size Test Results Change: Dispersion, Agglomeration and Sieving Conditions
    Oct 26, 2026
    Particle size is often treated as a fixed property of a powder. In practice, however, the reported result also depends on the physical state of the sample and the method used to measure it. A powder tested in an agglomerated dry state may behave differently after liquid dispersion. Fine particles affected by static electricity may remain on a test sieve even when their dimensions would otherwise allow them to pass. Changes in sample preparation, sieving time, dispersion conditions, or measurement principle can also affect the reported particle size distribution. This means that when two laboratories test the same material and obtain different results, neither laboratory has necessarily made an error. For QC and procurement engineers, the more useful question is not simply: “What is the particle size?” It is: “Under what sample condition and test method was that particle size measured?” Why Do Particle Size Test Results Change? Particle size results can change because the powder state and test conditions change. Agglomeration, dispersion, static electricity, wet or dry testing, sample preparation, test duration, and measurement principle can all affect the reported particle size distribution. Results should only be compared when the test method and sample conditions are controlled. When Agglomeration Makes Fine Powder Look Coarser Fine powders do not always behave as independent particles. Moisture, electrostatic attraction, surface forces, and handling conditions can cause smaller particles to associate with one another. When this happens, a test may respond to the agglomerate rather than to the individual particles inside it. In mechanical sieving, an agglomerate may remain above the sieve opening even though the individual particles would be small enough to pass. The retained fraction may therefore contain both genuinely oversized particles and clusters of smaller particles that have not been sufficiently dispersed. For supplier qualification, batch comparison, or incoming inspection, sample preparation and dispersion conditions should be controlled before numerical results are compared. When Dispersion Changes the Measured Distribution Dispersion can also change what the measurement system sees. A recent Malvern Panalytical application study used time-resolved laser diffraction to monitor spray-dried alumina granules during ultrasonic dispersion. As dispersion progressed, a coarser particle population decreased while a finer population became more pronounced. The important point is not the individual particle-size values. It is that the measured distribution changed as the physical state of the sample changed. Ultrasonic energy, liquid media, mixing conditions, and dispersion time may separate agglomerates or otherwise alter the particle population presented to the measurement system. This creates a practical laboratory question: At what point does dispersion reveal the particle state relevant to the application, and at what point does additional energy begin to alter that state? There is no universal answer. Different materials can respond differently to the same preparation procedure. For this reason, particle size methods should specify not only the instrument, but also the sample preparation and dispersion conditions. When Static Electricity Distorts Dry Sieving Dry sieve analysis introduces another important source of variation: electrostatic charge. Fine particles may adhere to the sieve mesh, sieve frame, container surfaces, or other particles. This can make an electrostatic problem look like a particle-size problem. If fine powder remains above the sieve, the immediate conclusion may be that those particles are larger than the sieve opening. But some particles may actually be small enough to pass and remain on the mesh because of static attraction or loose agglomeration. Increasing vibration does not necessarily eliminate the underlying electrostatic interaction. For laboratory sieve analysis, visible adhesion to the mesh or frame should therefore be treated as a warning that the retained fraction may contain more than genuinely oversized particles. This is especially relevant for fine polymer powders, pharmaceutical materials, chemical powders, and other materials prone to electrostatic charging. Why Wet Sieving Can Produce a Different Result Wet sieving can reduce problems associated with agglomeration, static electricity, or persistent mesh blockage. But wet sieving is not simply dry sieving with liquid added. The liquid becomes part of the test method. A suitable medium may improve dispersion, reduce static effects, and help fine particles pass through the sieve. At the same time, it may also alter the sample. Depending on the material and liquid, particles may dissolve, swell, soften, react chemically, or experience changes in surface behavior. A controlled wet-sieving method should therefore define the liquid medium, sample preparation, dispersing agents, rinsing procedure, drainage conditions, test duration, and endpoint criteria. The objective is not simply to make more material pass through the sieve. The laboratory should first determine whether high residue in dry sieving represents genuinely oversized particles or poor particle dispersion. For applications affected by static electricity, agglomeration, or wet-sieving conditions, our laboratory sieve shaker selection guide explains how these factors should be considered during equipment selection. Why Sieving Time and Endpoint Criteria Matter Sieving time can also change the reported result. Consider two laboratories testing the same powder with the same nominal sieve aperture. One runs the sieve shaker for five minutes. The other runs it for fifteen minutes. If material continues to pass through the sieve after the first five minutes, the two laboratories are not performing equivalent tests. Longer sieving may give particles more opportunities to reach an opening, change orientation, or separate from weak agglomerates. For this reason, instructions such as: “Sieve until it looks finished.” are unsuitable for comparative QC. When sieve analysis is used for batch release, supplier acceptance, or interlaboratory comparison, test duration or endpoint criteria should be defined in the SOP. The objective is reproducibility, not simply reducing the amount of material left above the sieve. Why Different Particle Size Methods Do Not Always Agree If two particle size reports disagree, one of the first questions should be whether the laboratories used the same measurement principle. A result expressed in micrometers does not necessarily represent the same physical quantity across different methods. Mechanical sieving determines whether a particle can pass through an opening of defined geometry under specified mechanical conditions. Laser diffraction evaluates light-scattering behavior and calculates an equivalent particle size distribution using an optical model. Dynamic image analysis evaluates projected particle images and can provide information related to both size and shape. These differences become especially important for irregular particles. An elongated particle may remain above a sieve when lying flat but pass through the same opening when it approaches at a different angle. Laser diffraction may report an equivalent diameter, while image analysis may describe length and width separately. The key point is: The same unit, μm, does not mean that different methods are measuring exactly the same physical quantity. This is why results generated by different techniques should not be compared without considering the measurement principle. Before Comparing Two Particle Size Reports, Check These 9 Conditions Before recalibrating an instrument, rejecting a batch, or questioning a supplier’s data, first determine whether the laboratories performed comparable tests. 1. Sample SourceWere the samples taken from the same batch using comparable sampling procedures? 2. Sample ConditionWere moisture level, storage conditions, and handling history comparable? 3. Sample PreparationWere drying, mixing, dividing, or other preparation procedures controlled? 4. Agglomeration and DispersionWas the material tested in a comparable and controlled physical state? 5. Measurement MethodDid both laboratories use the same analytical principle? 6. Wet or Dry ConditionsWas the powder tested under comparable environmental and dispersion conditions? 7. Sample QuantityWas a comparable amount of material introduced into each test? 8. Test DurationWere the same sieving or dispersion times used? 9. Endpoint CriteriaDid both laboratories use the same rule to determine when the test was complete? If these conditions differ, the reported particle size values may not be directly comparable even when both laboratories are operating their equipment correctly. How to Select Equipment Without Changing the Test Method The same logic should guide laboratory equipment procurement. A laboratory sieve shaker should not be selected first and then used to define the test method afterward. A more defensible sequence is: Understand powder behavior → Define the QC objective → Select the test method → Establish test conditions → Select equipment capable of repeating that method For free-flowing materials, conventional dry sieving may be appropriate. For powders affected by static electricity or agglomeration, sample preparation may need to be reconsidered, or wet sieving may need to be evaluated. For irregular particles, the mechanical motion of the sieve shaker can become part of the method. For very fine powders or applications requiring detailed particle size distributions, another analytical technique may be more suitable than mechanical sieving alone. Particle size data become useful when the conditions behind the numbers are understood. For procurement, R&D, and QC teams, reliable comparison requires more than matching the unit “μm” on two reports. It requires comparing the sample condition, test method, and operating procedure behind those numbers. When these conditions are controlled, particle size data become far more useful for batch comparison, supplier qualification, incoming quality control, process development, and material acceptance decisions.
    ĐỌC THÊM

để lại tin nhắn

để lại tin nhắn
Nếu bạn quan tâm đến sản phẩm của chúng tôi và muốn biết thêm thông tin chi tiết, vui lòng để lại tin nhắn ở đây, chúng tôi sẽ trả lời bạn sớm nhất có thể.
nộp

Giờ làm việc của chúng tôi

Thứ Hai - Thứ Bảy: 8:00 sáng - 6:00 chiều

LIÊN HỆ VỚI CHÚNG TÔI :lvobo2026@gmail.com

Trang chủ

Các sản phẩm

whatsApp

liên hệ